Saving Corporate Colour Theme for all Visualizations


It was easy to add the Corporate Colour theme to one Visualization, how do we set it for our Data Visualization site, so it is set once as the one colour theme to always use?
Answers
-
Great question @KathleenWesthaver! We're glad the color theme was easy to apply to your dashboard.
At this time, setting a default color theme at the site level isn't available as a built-in feature. Themes currently need to be applied on a per-dashboard basis. That said, this is a great suggestion and something we can flag for our product team as a feature request.
Thanks for the feedback!
Marius
Client Success Consultant at Foundant
1 -
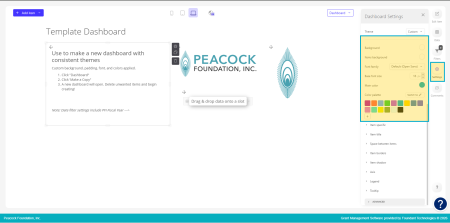
As a work around, I created a "Template Dashboard" that I use for every new dashboard I make. Today, I had a call with @MariusDereska and took this Template a step further when I learned how to also change the data set colors so that graphs have continuity!
—————For my Template Dashboard I used the Dashboard Settings to set fonts, sizes, and theme colors to align with our branding. I also included commonly used logos and a Date Filter that is customized to our Fiscal Year.
Now, whenever I make a new dashboard, I "make a copy" of my Template Dashboard and I'm all set!
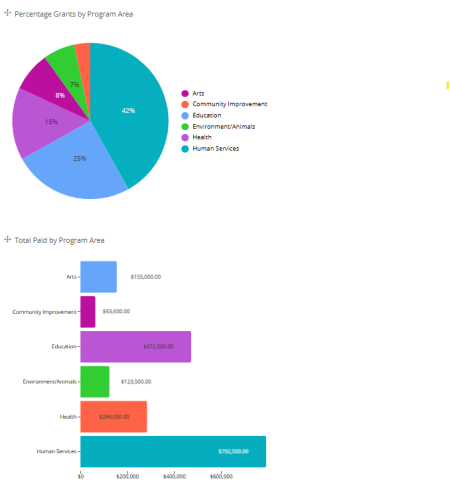
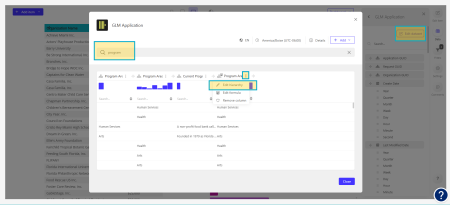
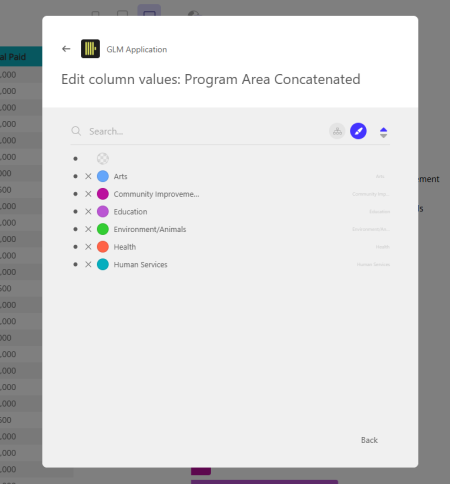
For graph continuity (image below), I clicked into the Data Set I wanted to edit and changed the color of the hierarchy. Changing at the Data Set Level pushed the colors across all dashboards. One real-life example; Program Area now has all "Environment/Animals" reading as a Green color in all dashboards/in any kind of chart! (Note: My program areas contain a formula which is why the data set looks a little different)
 5
5